
When Do Parents Need a Lawyer for School Bullying?
Most bullying cases do not need a lawyer. Some clearly do. Knowing the difference before you act matters more than most parents realize. The decision
1. Audio
2. Definition
3. Video
4. Core Thesis
9. Action Steps
10. FAQs
11. Call to Action
12. Sources
13. Signature
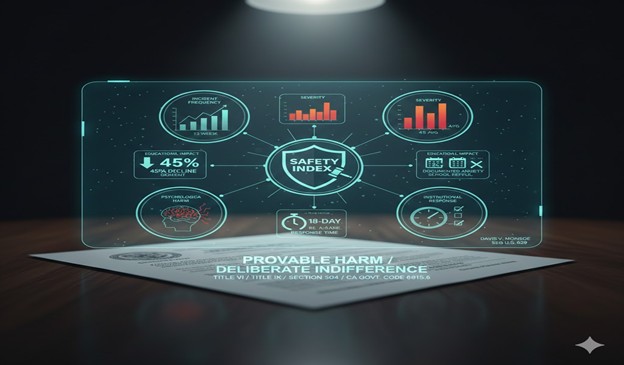
The Safety Index is a quantifiable measurement system that converts subjective harassment claims into objective, timestamped data tracking: incident frequency (events per time period), severity (using standardized 1-5 scale), educational impact (GPA decline, attendance drops, participation reduction), psychological harm (documented anxiety, school refusal), and institutional response adequacy (investigation timelines, actions taken)—creating numerical evidence that proves persistent or pervasive harassment under Title VI/Title IX/Section 504, establishes foreseeability for negligence claims by showing escalating patterns, demonstrates causation between district failures and measurable student harm, and defeats district claims of “isolated incidents” by aggregating what schools intentionally fragment, making the Safety Index enforceable under California law because courts cannot dismiss mathematical proof that 4.2 incidents per week over 12 weeks with 45% GPA decline and 18-day average response time constitutes deliberate indifference under Davis v. Monroe 526 U.S. 629 and violation of mandatory duty under California Government Code Section 815.6.
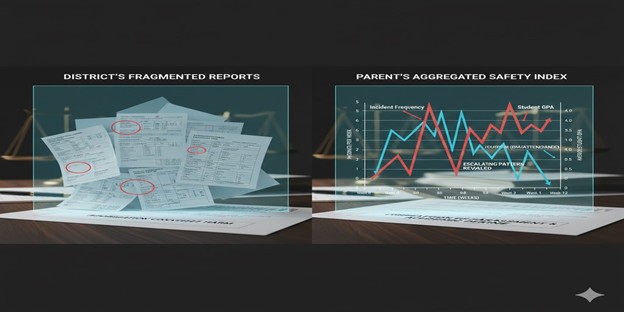
California districts defeat accountability by fragmenting incidents across time and claiming harm is subjective—but when parents aggregate incidents into a Safety Index measuring frequency, severity, educational impact, and response times with timestamps and numerical scores, subjective disputes transform into mathematical patterns courts cannot dismiss. We convert trauma into code by creating standardized metrics: 4.2 incidents per week (proving “pervasive” under Title IX), 45% GPA decline (proving educational access denial), 23-day average investigation time versus 5-day policy requirement (proving deliberate indifference), creating objective data that satisfies legal standards under Davis v. Monroe, California Civil Code § 1714, and California Government Code § 815.6. Selective enforcement IS discrimination when Safety Index data reveals Black students experience 4.2 incidents/week with 18-day response times while white students experience 0.8 incidents/week with 3-day responses, proving Title VI disparate treatment through measurements districts cannot dispute. This article establishes the Safety Index as SANI’s signature framework for defeating institutional gaslighting with provable mathematical failure.

The Student Advocacy Network Institute (SANI) is a Policy-Driven Student Safety Agency that created the Safety Index as mathematical proof against institutional gaslighting—a standardized measurement system that aggregates what districts intentionally fragment, converting “we don’t see a pattern” denials into provable failures through objective data that satisfies Title IX persistent/pervasive standards, tort law foreseeability requirements, and California mandatory duty violations.
SANI teaches parents to track five core metrics from day one: incident frequency (events per week), severity scores (1-5 scale), educational impact (GPA, attendance, participation percentages), institutional response times (days to investigate), and comparative treatment (how district responds to similar conduct by other students). When districts claim “isolated incidents,” parents produce Safety Index data showing 4.2 incidents per week over 12 weeks—proving systematic failure courts cannot excuse.
SANI’s enforcement work centers safety and civil rights, not data analysis. The Safety Index matters because it defeats the primary defense districts use—fragmentation and subjectivity—by creating objective, timestamped, quantifiable evidence that proves what victims experience: relentless, escalating harm met with inadequate, delayed, discriminatory responses.
The Safety Index operationalizes legal standards that require proof of patterns, persistence, severity, and causation—transforming abstract legal requirements into measurable data.
Under Davis v. Monroe 526 U.S. 629 and 34 CFR § 106.30, harassment must be “sufficiently severe, pervasive, or persistent” to create hostile environment. Courts struggle with subjective terms—what’s “pervasive”?
Safety Index Solution: Frequency data creates objective “pervasive” proof. 4.2 incidents per week over 12 weeks = 50+ incidents. No court calls 50 incidents “isolated.” Severity Index using standardized scale (1=verbal, 5=assault) proves escalation from 2.0 to 4.5 average, satisfying “severe” even if individual incidents seem minor.
California Civil Code § 1714 requires proving harm was foreseeable. Districts claim “we couldn’t predict this.”
Safety Index Solution: Escalating frequency (2.5 → 6.8 incidents/week) and severity (2.0 → 4.5) prove trajectory made serious harm predictable. Timeline showing reports made at Weeks 2, 4, 6, 8, 10 with no effective response proves district had notice yet failed to prevent foreseeable escalation.
When districts adopt policies with mandatory timelines (“shall investigate within 5 days”), violations create liability.
Safety Index Solution: Institutional Response Index measuring actual timelines (average 23 days) versus policy requirements (5 days) proves 360% policy violation rate. Courts cannot excuse systematic delays when data proves pattern.
Proving discrimination requires comparative data showing protected-class students treated worse than others.
Safety Index Solution: Comparative Treatment Index measures response times by student demographics. If Black students’ incidents average 18-day investigation while white students average 3 days, that 600% disparity proves Title VI violation regardless of intent.
Legal claims require proving district’s inadequate response caused measurable harm.
Safety Index Solution: Overlay Educational Impact Index (declining GPA, attendance) with Incident Frequency and Institutional Response timelines. When GPA drops from 3.8 to 2.1 precisely as incidents increase from 2.5 to 6.8/week and district response remains inadequate, causation is mathematical: harm escalated because district failed to act despite notice.
Safe Place to Learn Act requires districts eliminate conditions preventing educational access.
Safety Index Solution: Educational Impact metrics prove harassment prevented access—45% GPA decline, 22-point attendance drop, 80% participation reduction. These aren’t subjective claims; they’re documented outcomes proving the hostile environment the district failed to eliminate.
Track every incident with date/time. Calculate incidents per week. Plot trend over time. Increasing frequency proves escalation establishing foreseeability and satisfying “persistent” under Title IX. Example: Week 1: 2 incidents, Week 12: 7 incidents = 250% increase. Legal application: Davis v. Monroe requires persistent conduct; frequency data provides objective persistence proof.
Create standardized scale: 1=verbal comments, 2=sustained verbal/exclusion, 3=property damage/threats, 4=physical contact/sexual harassment, 5=assault/explicit sexual conduct. Rate each incident, calculate weekly averages, track escalation. Legal application: 34 CFR § 106.30 evaluates severity; increasing average from 2.0 to 4.5 proves escalating danger requiring district response.
Quantify harm: GPA decline percentage, attendance decline percentage, standardized test comparison, class participation reduction, lost opportunities (dropped classes/activities). This proves Title IX denial of educational access. Legal application: Title IX requires showing harassment denied access (34 CFR § 106.30); 45% GPA decline proves denial courts cannot dismiss.
Measure district adequacy: days from report to acknowledgment, days to investigation start, days to completion, percentage of reports resulting in action, safety measures implemented (count), notifications provided (count). Compare to district’s own policies. Legal application: Policy violations prove mandatory duty breach under California Government Code § 815.6; delays prove deliberate indifference under Davis v. Monroe.
Track response times and outcomes for comparable conduct by student demographics (obtain through Public Records Act requests). Calculate average investigation days by race/disability. Disparities prove discrimination. Legal application: Title VI requires showing disparate impact; if Black students experience 600% longer investigation times, that proves violation regardless of intent.

Immediately create spreadsheet with five tabs: Incident Frequency, Severity, Educational Impact, Response Times, Comparative Treatment. Log first incident with date/time/description/severity rating (1-5). Do this same day, every incident. Create baseline: request student’s GPA, attendance, participation grades from prior semester as comparison. This contemporaneous tracking defeats later district claims of exaggeration.
Each week: calculate total incidents, average severity score, compare current GPA/attendance to baseline, calculate days elapsed since each report without resolution. Create simple line graphs showing trends. Even 4-6 weeks of data showing escalation proves pattern. Update after each new incident or district response (or non-response).
File California Public Records Act request: “All harassment complaints past 24 months showing: student demographics (race, disability status), date reported, date investigation started, date completed, outcome. Requesting to analyze institutional response patterns.” When data shows your child’s demographic group faces longer response times, that’s objective discrimination proof.
Once you have 4+ weeks of data, include summary in all correspondence: “Safety Index data shows 3.8 incidents/week (up from 2.0), average severity 3.2 (up from 2.0), GPA declined 28%, attendance declined 15%, your average response time 21 days versus 5-day policy requirement. This quantifies deliberate indifference under Davis v. Monroe and mandatory duty violation under California Government Code § 815.6.”
When filing OCR complaints, state complaints, or litigation, attach: frequency line graph, severity trend chart, educational impact comparison (before/after), response time analysis, comparative treatment data if available. Courts and investigators respond to visual data. Include statement: “Safety Index methodology attached as Exhibit A demonstrates persistent harassment (frequency), severe impact (severity + educational decline), and deliberate indifference (response failures) satisfying all legal standards.”
A Latina eighth-grader in Los Angeles experiences daily harassment. Her mother reports repeatedly. The school responds: “We don’t see a pattern. These seem like isolated incidents.”
The mother retains an attorney who creates a Safety Index over 12 weeks:
Incident Frequency: Weeks 1-4: 2.5 incidents/week → Weeks 9-12: 6.8 incidents/week (272% increase)
Severity Scale (1-5): Week 1: 2.0 average (verbal) → Week 12: 4.5 average (physical contact, sexual comments) (225% increase)
Educational Impact: GPA 3.8 → 2.1 (45% decline), Attendance 98% → 76%, Class participation 80% reduction per teacher reports
District Response: Average 23 days from report to investigation, 12% of reports resulted in action (2 of 17), Zero safety measures implemented, Zero parent notifications
The attorney presents this data to OCR with visual graphs. OCR immediately recognizes the pattern. The district’s attorney realizes they cannot dispute mathematical evidence showing 272% frequency increase, 225% severity escalation, and 45% GPA decline while claiming “no pattern.”
Discovery reveals internal email: “If we acknowledge this as a pattern, it triggers Title IX formal investigation and liability. Keep treating each incident separately.”
The Safety Index broke the district’s fragmentation strategy. Settlement includes compensatory damages, perpetrator removal, mandatory Safety Index tracking for all harassment complaints, and three years of monitoring.
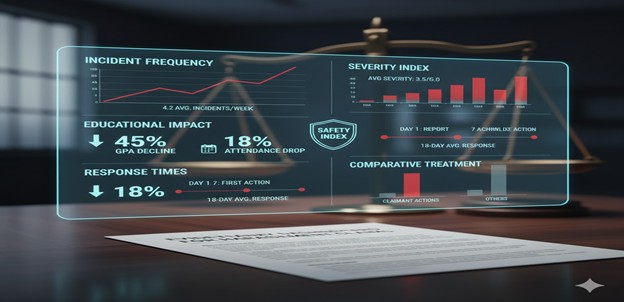
The Safety Index is SANI's measurement system converting subjective harassment claims into objective data by tracking incident frequency, severity (1–5 scale), educational impact (GPA or attendance decline), and district response times. It matters because districts often claim incidents are “isolated” or “subjective.” Quantified evidence—such as 4.2 incidents per week over 12 weeks combined with measurable GPA decline—demonstrates hostile environment conditions under Title IX and establishes foreseeability under negligence law.
Start immediately after the first incident, even if it appears minor. The strength of the Safety Index comes from demonstrating escalation over time. Obtain baseline academic and attendance data from the period before harassment began so “before-and-after” comparisons can demonstrate causation. Contemporaneous tracking—logging each incident the same day—prevents claims that reports were reconstructed later.
Use a standardized 1–5 scale: 1 = verbal comments or rumors; 2 = sustained verbal harassment or exclusion; 3 = threats, property damage, or cyberbullying; 4 = physical contact, stalking, or sexual harassment; 5 = assault, explicit sexual conduct, or weapon involvement. Rate incidents immediately and calculate weekly averages. Increasing averages demonstrate escalation and provide objective evidence of growing risk.
Deliberate indifference is measured by comparing known circumstances to institutional response. The Safety Index shows: (1) frequency establishing the scope
If you want student harm treated like a school safety and civil rights issue—start with SANI at https://saninstitute.net
Most bullying cases do not need a lawyer. Some clearly do. Knowing the difference before you act matters more than most parents realize. The decision

There is a point in many bullying cases where the parent has done everything right — and it still is not working. The emails are

You have three minutes. Make them the most organized three minutes the board has heard on this topic. Speaking at a school board meeting is

Patience with a school that isn’t responding isn’t a virtue. At some point it becomes a cost your child is paying. Most parents start at